
How Much of Retail Search Now Sits Under an AI Overview?
18 US multi-location retail brands, 9.58M keywords. 31.4% now trigger a Google AI Overview, and domain authority does not predict exposure.
Article details
Author
Abby Di Niro
Founder & Lead Strategist
Abby leads strategy, measurement, and revenue planning for enterprise, franchise, and multi-location growth programs.
View author profileMost published research on Google AI Overviews measures how many queries in a sample return a generated answer. That tells you something about Google, but very little about your own position, because no brand ranks for a representative sample of the internet. So we inverted the unit of analysis and measured brand footprints instead. Across 18 US multi-location retail and consumer brands, covering 9,579,636 ranking keywords, 31.4% now sit underneath an AI Overview. The more useful finding is what does not explain that number: domain authority.
What did this study measure?
For each brand we took the full set of keywords that brand currently holds an organic ranking for in the Semrush US index, then counted how many of those same keywords also return a Google AI Overview. Exposure is the second number divided by the first. In plain terms, it answers the question a marketing director actually asks, which is what share of the demand I have already earned now sits underneath a generated answer.
The sample is 18 US multi-location retail and consumer brands, selected across six categories to reflect businesses that operate physical locations at scale: jewelry, kids apparel, convenience, restaurant, specialty retail, and home and outdoor. Every figure was retrieved on 25 August 2026. Authority Score and referring domain counts come from the same index on the same date, so the comparison is internally consistent.
How much of retail search sits under an AI Overview?
Across the full sample, 31.4% of ranking keywords return an AI Overview. That is 3,012,488 keywords out of 9,579,636. The mean brand-level rate was 33.2% and the median was 30.3%, which tells us the aggregate is not being dragged by one or two outliers with enormous footprints.
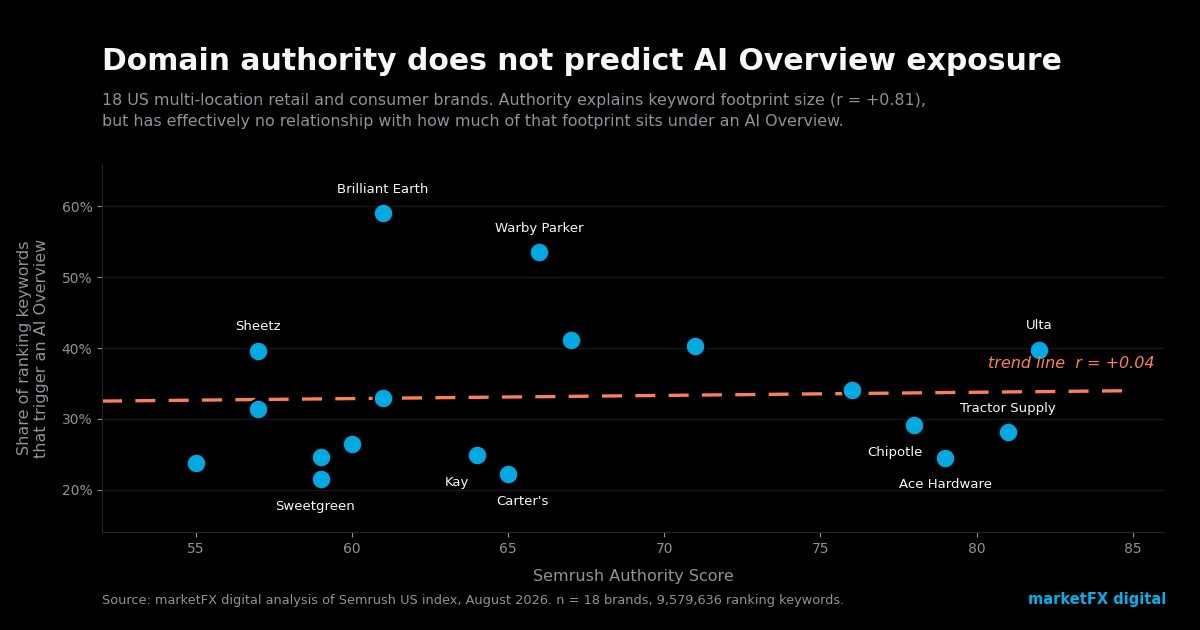
The more useful number is the spread. Exposure ranged from 21.5% at Sweetgreen to 59.0% at Brilliant Earth, a difference of 37.5 percentage points, with a standard deviation of 10.4 points. For a brand trying to plan against this, that spread is the finding. A category benchmark will mislead you by a wide margin in either direction.
Does domain authority predict AI Overview exposure?
No, and this was the result we did not expect. The correlation between Semrush Authority Score and AI Overview exposure across the sample was r = +0.04, which is indistinguishable from no relationship. Referring domain count performed no better at r = +0.06.
The obvious objection is that the authority metric might simply be noisy in a sample this size. It is not. Within the same 18 brands, Authority Score correlated with total organic keyword count at r = +0.81, which is a strong and entirely sensible relationship. Stronger domains do rank for more things. The metric is measuring what it claims to measure. It just has nothing to say about whether the things you rank for are being summarized above you.
Splitting the sample into authority tertiles makes the same point without correlation coefficients. The lowest-authority third averaged Authority Score 57.8 and 27.9% exposure. The middle third averaged 64.0 and 39.0%. The highest third averaged 77.8 and 32.6%. The relationship is not weak, it is absent, and it does not move in a consistent direction.
Building domain authority remains the correct investment for ranking, and nothing here argues otherwise. But a brand cannot buy its way out of AI Overview exposure through link acquisition, because exposure is a property of the queries in your footprint and how Google chooses to answer them. That is the argument underneath generative engine optimization as a distinct discipline.
Why do brands with identical authority diverge by 34 points?
| Brand A | AS | Exposure | Brand B | AS | Exposure | Gap |
|---|---|---|---|---|---|---|
| Brilliant Earth | 61 | 59.0% | Kay Jewelers | 64 | 24.9% | 34.1 pts |
| Warby Parker | 66 | 53.5% | Carter's | 65 | 22.2% | 31.3 pts |
| Sheetz | 57 | 39.6% | Sweetgreen | 59 | 21.5% | 18.1 pts |
| Ulta Beauty | 82 | 39.7% | Tractor Supply | 81 | 28.1% | 11.6 pts |
Brilliant Earth and Kay are the clearest illustration. Both sell engagement rings, both operate physical showrooms, and Kay holds the stronger domain by three authority points and a larger keyword footprint. Yet Brilliant Earth carries more than twice the AI Overview exposure. The plausible explanation is query composition rather than domain strength. Brilliant Earth's footprint skews toward education and comparison language, the kind of question Google answers with a summary, while Kay's skews toward branded and product navigation, which Google still answers with links and shopping units.
That interpretation is consistent with the broader picture, though this dataset cannot prove it on its own. Establishing it properly would require classifying every keyword by intent, which is the natural extension of this work.
Which retail categories are most exposed?
| Category | Brands | AI Overview rate | Local pack rate |
|---|---|---|---|
| Specialty retail | 2 | 46.6% | 10.1% |
| Convenience | 4 | 38.1% | 30.6% |
| Jewelry | 3 | 36.2% | 17.7% |
| Home and outdoor | 3 | 28.9% | 13.7% |
| Restaurant | 3 | 27.9% | 23.9% |
| Kids apparel | 3 | 24.1% | 9.0% |
The roughly twofold gap between specialty retail and kids apparel is larger than any effect attributable to domain strength anywhere in the dataset. Categories where buyers research before purchasing, comparing lens coatings or diamond certifications or ingredient lists, carry materially more exposure than categories where buyers already know what they want and are looking for a size and a price.
With three brands in most categories, read these figures as directional rather than settled.
Does a strong local pack presence protect you?
This was the question we most expected to produce a clean answer, given how often multi-location operators assume their local footprint insulates them. It did not. Across the sample, local pack rate and AI Overview rate correlated at r = -0.04, meaning the two features vary independently at brand level.
The convenience category makes the point most directly. Those four brands carried the highest average local pack rate in the sample at 30.6% and simultaneously the second highest AI Overview rate at 38.1%. A brand can be extremely well represented in local results and still have most of its non-local footprint summarized above the fold.
Published research supports the narrower claim that queries with explicit local intent tend to return a local pack rather than an AI Overview, with SERPs.io reporting that local intent queries fire the local pack in 92% to 96% of cases. Our finding does not contradict that. It qualifies it. Query-level protection on local searches does not translate into brand-level protection, because a multi-location brand's keyword footprint is mostly not local intent. This is the practical core of local SEO for multi-location brands as we now practice it.
Why is this higher than the widely cited 14% figure?
The most cited figure in this space comes from a Visibility Labs analysis of 20,900,323 shopping keywords, reported by Search Engine Land in March 2026, which found that 2,919,229 of those queries returned an AI Overview, a rate of 14.0%. That study also documented a rise from 2.1% in November 2025, a 5.6 times increase across four months.
Our 31.4% does not contradict that finding, because the two studies measure different populations. Visibility Labs sampled product-intent queries identified by the presence of a shopping box, which is a deliberately narrow and transactional slice. We measured entire brand footprints, which contain far more informational, comparison, and long-tail language. Since informational retail queries trigger AI Overviews at roughly 23% against 14% for transactional ones, a brand-level figure sitting well above the transactional rate is what the existing literature would predict.
Both numbers are correct and they answer different questions. If you want to know how Google treats product queries as a class, 14% is right. If you want to know how much of your own earned demand is now mediated, you have to measure your own footprint, and this study suggests that number will be roughly twice the shopping-query benchmark.
What should a multi-location brand do about this?
The first move is measurement, and it is not optional given a 37.5 point spread across brands in the same broad sector. Any brand adopting a published category average as a planning input is likely to be wrong by 10 points or more in one direction. Pulling your own exposure rate takes an afternoon with any rank tracking tool that reports SERP features.
The second move is to stop treating your keyword footprint as one population. Once you know which queries sit under an AI Overview and which do not, you are looking at two different optimization problems that happen to share a domain. Queries without an overview still respond to conventional ranking work: title relevance, internal linking, page depth, and the technical foundations that have always applied. Queries with an overview require extractable answer formatting, unambiguous entity signals, and third-party corroboration, because a generated answer is assembled from sources the model can verify elsewhere.
This is the split our GEO Visibility Stack was built to handle. The stack separates retrieval, which is whether an engine can access and parse your content at all, from extraction, which is whether your content is structured in a form an answer can quote, from corroboration, which is whether other credible sources confirm what you claim about yourself. Most brands we audit are competent at the first, inconsistent at the second, and have done almost nothing about the third. Corroboration is usually the binding constraint, and it cannot be solved on your own website, which is a conclusion this dataset reinforces.
For brands operating across many locations, the sequencing is set out in our multi-location and franchise practice, and the measurement layer sits inside marketing analytics and reporting. Teams wanting the tooling landscape first should start with generative engine optimization tools.
The full dataset
All figures are from the Semrush US index on 25 August 2026, reproduced in full so the study can be checked and repeated.
| Brand | Category | Authority | Ranking keywords | AI Overview keywords | Exposure |
|---|---|---|---|---|---|
| Brilliant Earth | Jewelry | 61 | 198,168 | 116,946 | 59.0% |
| Warby Parker | Specialty | 66 | 248,440 | 132,917 | 53.5% |
| Wawa | Convenience | 67 | 164,126 | 67,685 | 41.2% |
| 7-Eleven | Convenience | 71 | 188,433 | 76,008 | 40.3% |
| Ulta Beauty | Specialty | 82 | 1,401,301 | 556,664 | 39.7% |
| Sheetz | Convenience | 57 | 26,222 | 10,373 | 39.6% |
| REI | Home and outdoor | 76 | 1,283,412 | 437,059 | 34.1% |
| Portillo's | Restaurant | 61 | 78,260 | 25,845 | 33.0% |
| QuikTrip | Convenience | 57 | 102,090 | 32,100 | 31.4% |
| Chipotle | Restaurant | 78 | 446,459 | 129,797 | 29.1% |
| Tractor Supply | Home and outdoor | 81 | 2,648,680 | 744,994 | 28.1% |
| The Children's Place | Kids apparel | 60 | 110,074 | 29,029 | 26.4% |
| Kay Jewelers | Jewelry | 64 | 454,187 | 113,252 | 24.9% |
| Zales | Jewelry | 59 | 287,765 | 71,002 | 24.7% |
| Ace Hardware | Home and outdoor | 79 | 1,641,452 | 401,838 | 24.5% |
| Hanna Andersson | Kids apparel | 55 | 40,629 | 9,661 | 23.8% |
| Carter's | Kids apparel | 65 | 213,069 | 47,260 | 22.2% |
| Sweetgreen | Restaurant | 59 | 46,869 | 10,058 | 21.5% |
What this study does not show
Three limitations are worth stating plainly, because a study that hides them is not worth citing.
Exposure is not citation. This dataset establishes whether a brand's ranking keywords return an AI Overview. It does not establish whether the brand appears as a cited source inside that overview, which is the metric most brands actually care about. Measuring citation properly means tracking a fixed prompt set across engines over time, which is what share of model describes.
This is Google only. AI Overviews are one surface. ChatGPT, Perplexity, Gemini, and Copilot each select sources differently, and nothing here transfers to them automatically. A brand with low AI Overview exposure may still be invisible in assistant answers, and the reverse is equally possible.
The sample is 18 brands across six categories. That supports the headline finding on authority, because that effect is measured across all 18, but supports the category breakdown only directionally. We would not defend the category ordering as settled, and we would defend the authority finding.
All three point at the same next study, which is keyword-level intent classification across a larger sample paired with citation tracking across multiple engines. We would rather say what this study cannot answer than let a reader assume it answers more than it does.
Related services
FAQs
Frequently Asked Questions
- What percentage of retail keywords trigger an AI Overview?
- Across the 18 US multi-location retail and consumer brands in this study, 31.4% of ranking keywords returned a Google AI Overview, measured across 9,579,636 keywords in the Semrush US index in August 2026. Individual brands ranged from 21.5% to 59.0%, so the aggregate conceals a wide spread and should not be treated as a planning number for any single brand.
- Does domain authority protect a brand from AI Overviews?
- No. In this sample the correlation between Semrush Authority Score and AI Overview exposure was r = +0.04, which is no relationship at all. The same metric correlated strongly with the size of a brand's keyword footprint at r = +0.81. Authority determines how much you rank for, not how much of that ranking sits underneath a generated answer.
- Why is 31.4% higher than the widely reported 14% figure?
- The two numbers measure different things. The 14% figure from Visibility Labs measures how many shopping queries in a defined sample return an AI Overview. This study measures what share of a brand's existing ranking footprint carries one. Brand footprints contain large volumes of informational and comparison long-tail, which triggers AI Overviews far more often than transactional product queries do.
- Which retail categories have the highest AI Overview exposure?
- In this sample, specialty retail averaged 46.6%, convenience 38.1%, and jewelry 36.2%. Home and outdoor averaged 28.9%, restaurant 27.9%, and kids apparel 24.1%. The spread between highest and lowest category was roughly twofold, a larger effect than anything attributable to domain authority.
- Does the local pack protect multi-location brands from AI Overviews?
- Not in the way many multi-location operators assume. Across this sample the correlation between local pack rate and AI Overview rate was r = -0.04, meaning the two features vary independently at brand level. Convenience brands carried both the highest local pack rate at 30.6% and the second highest AI Overview rate at 38.1%.
- How was AI Overview exposure measured?
- Exposure is the count of keywords for which a domain holds an organic ranking and the SERP also returns an AI Overview, divided by that domain's total organic keyword count. Both figures come from the Semrush US index, retrieved on 25 August 2026. This measures whether a brand's demand sits under a generated answer, not whether the brand is cited inside it.
- What should a multi-location retail brand do about AI Overview exposure?
- Start by measuring your own exposure rate rather than assuming a category average, because the brand-level spread in this study was 37.5 percentage points. Then separate your footprint into queries that sit under an AI Overview and queries that do not, and treat those as two different optimization problems.
See how much of your demand is now mediated
We run this same measurement inside client engagements, across your footprint rather than a published average. Book a working session and we will pull your exposure number with you.